US Irradiance Maps
US Irradiance Maps
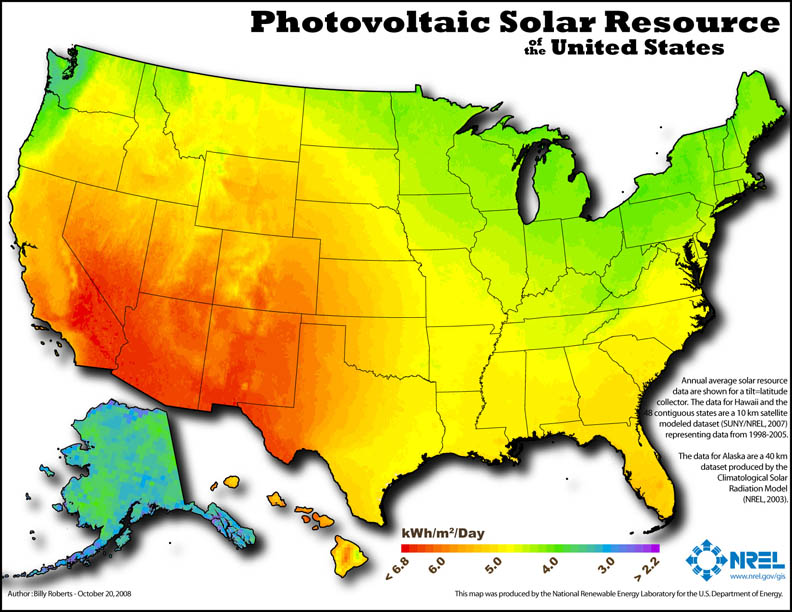
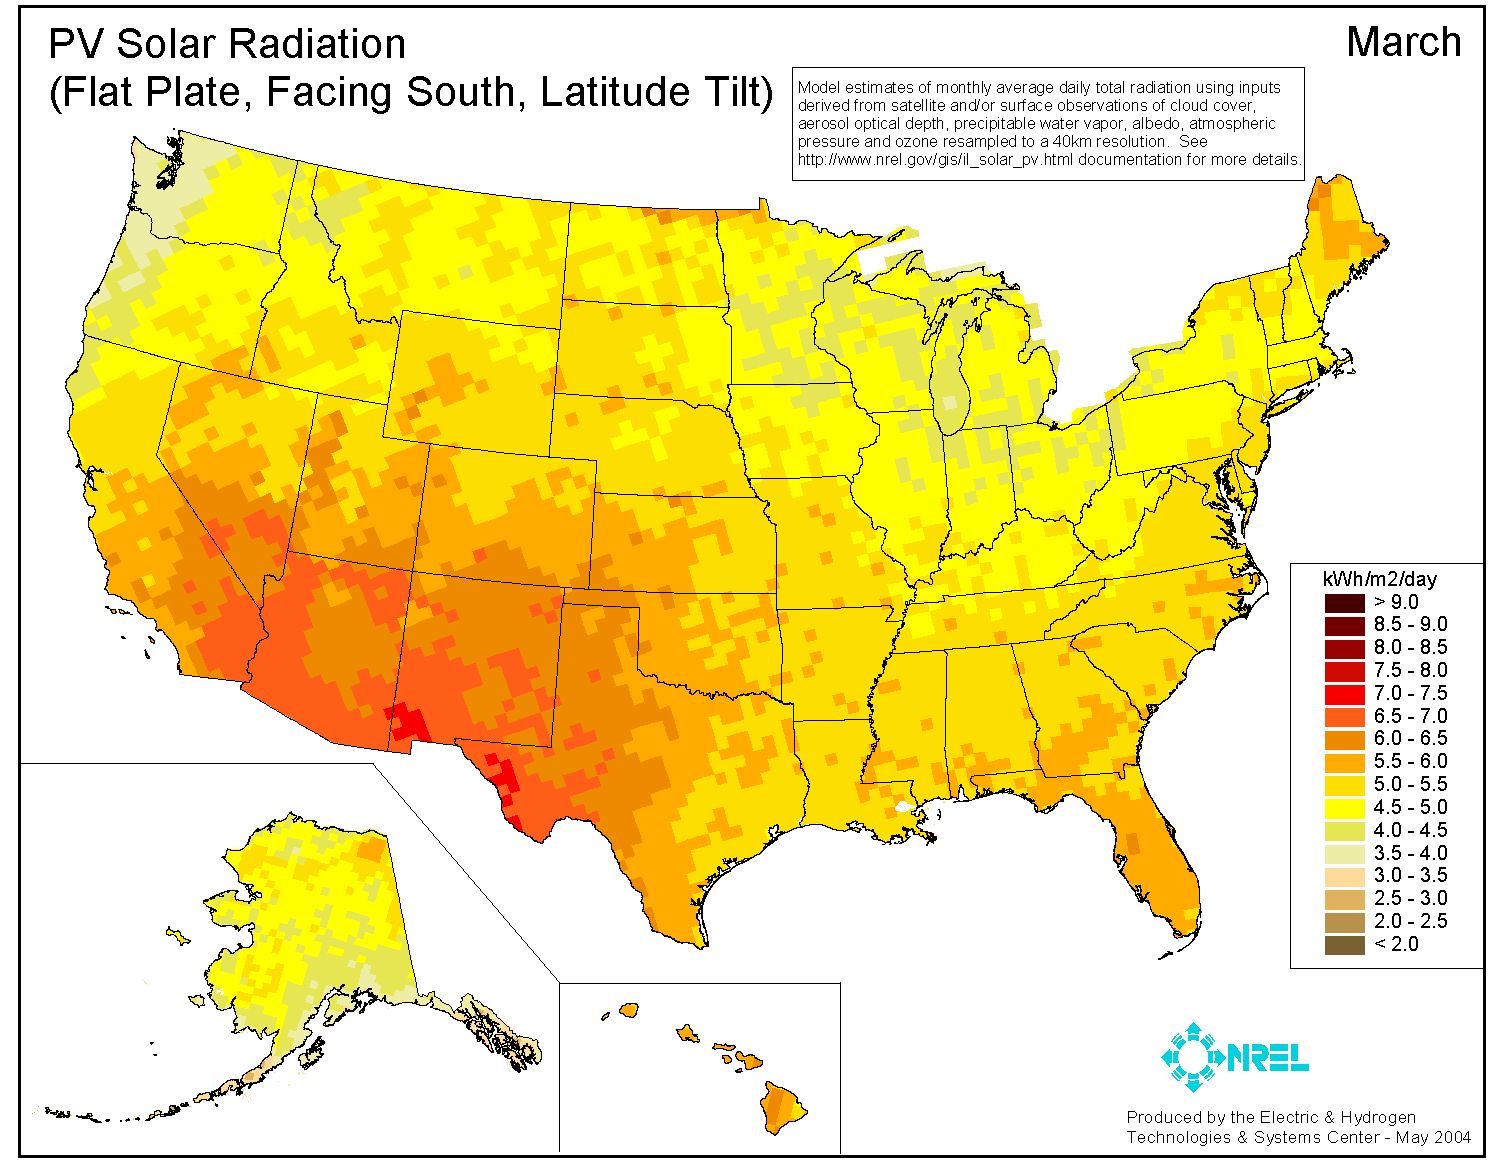
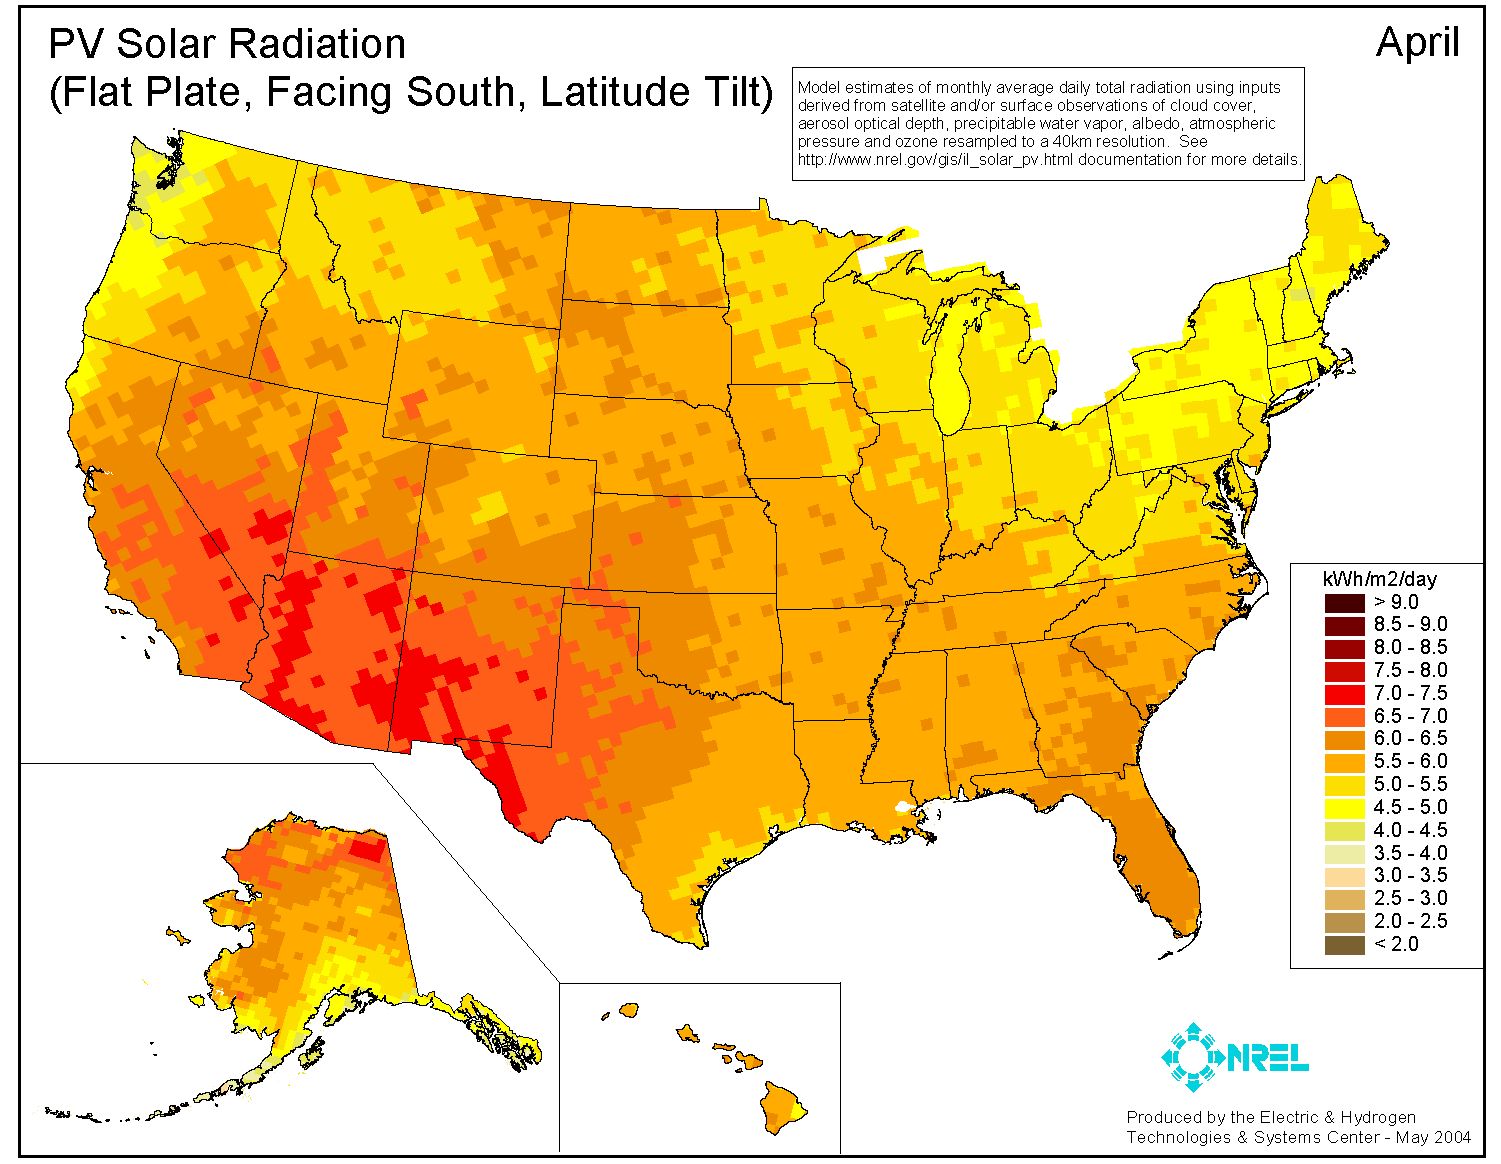
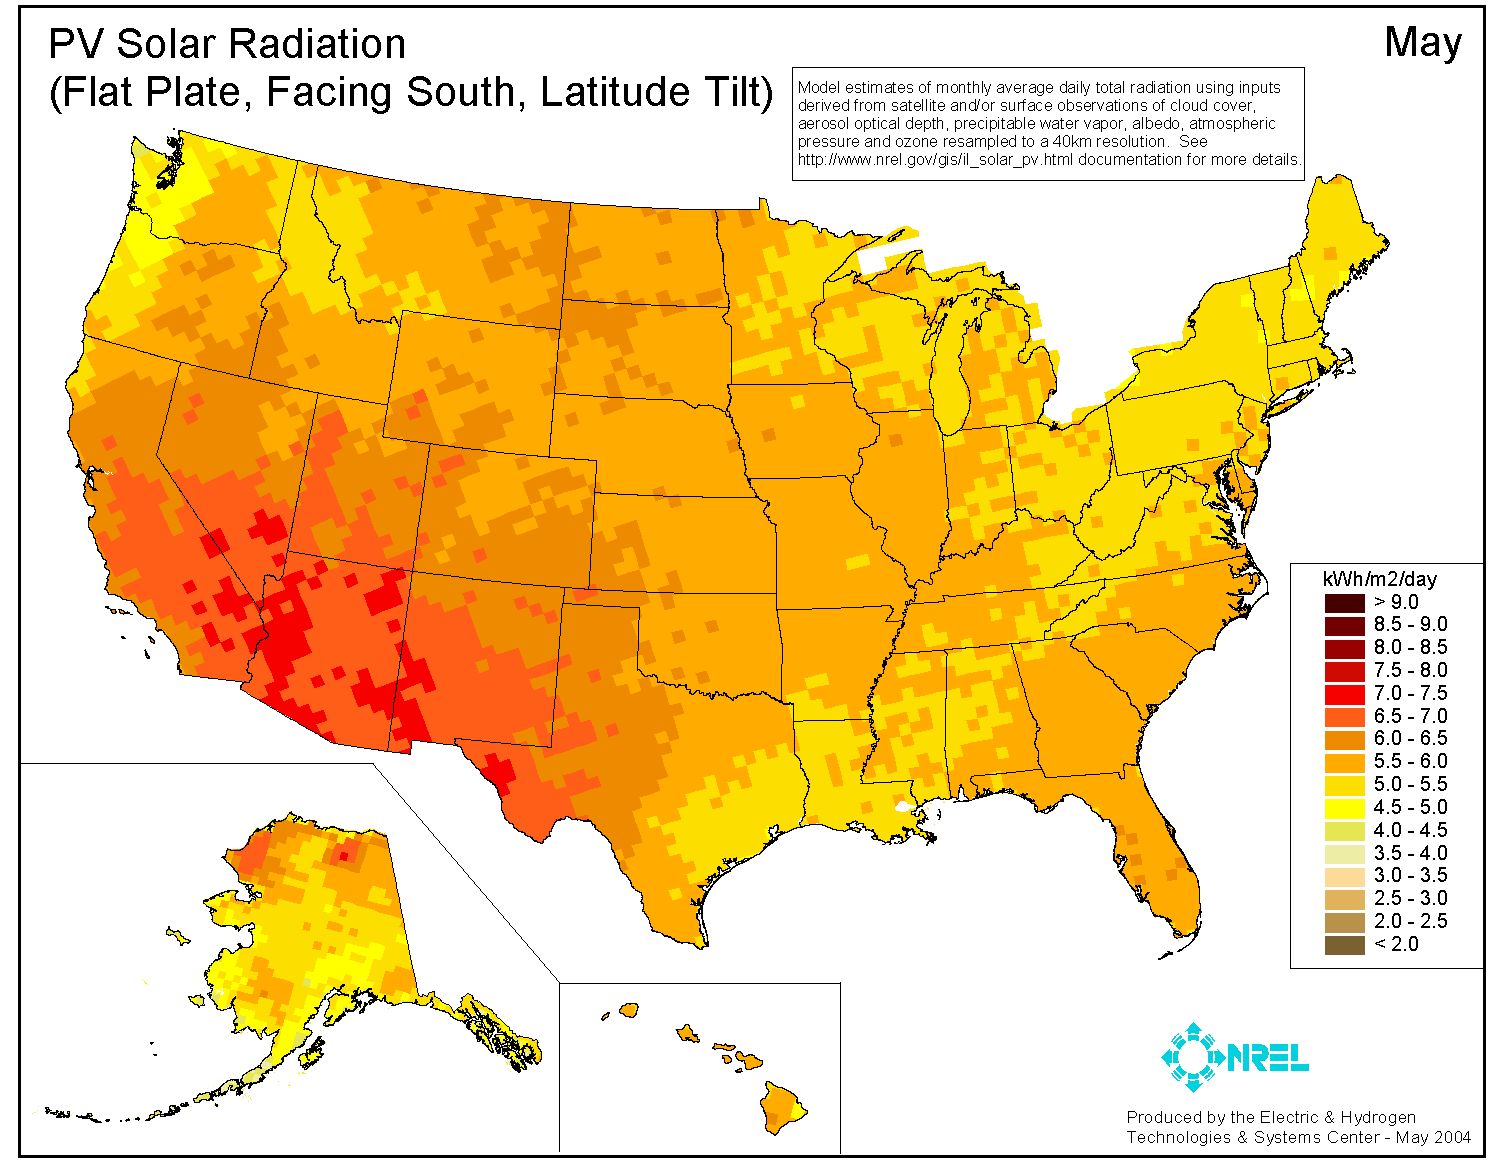
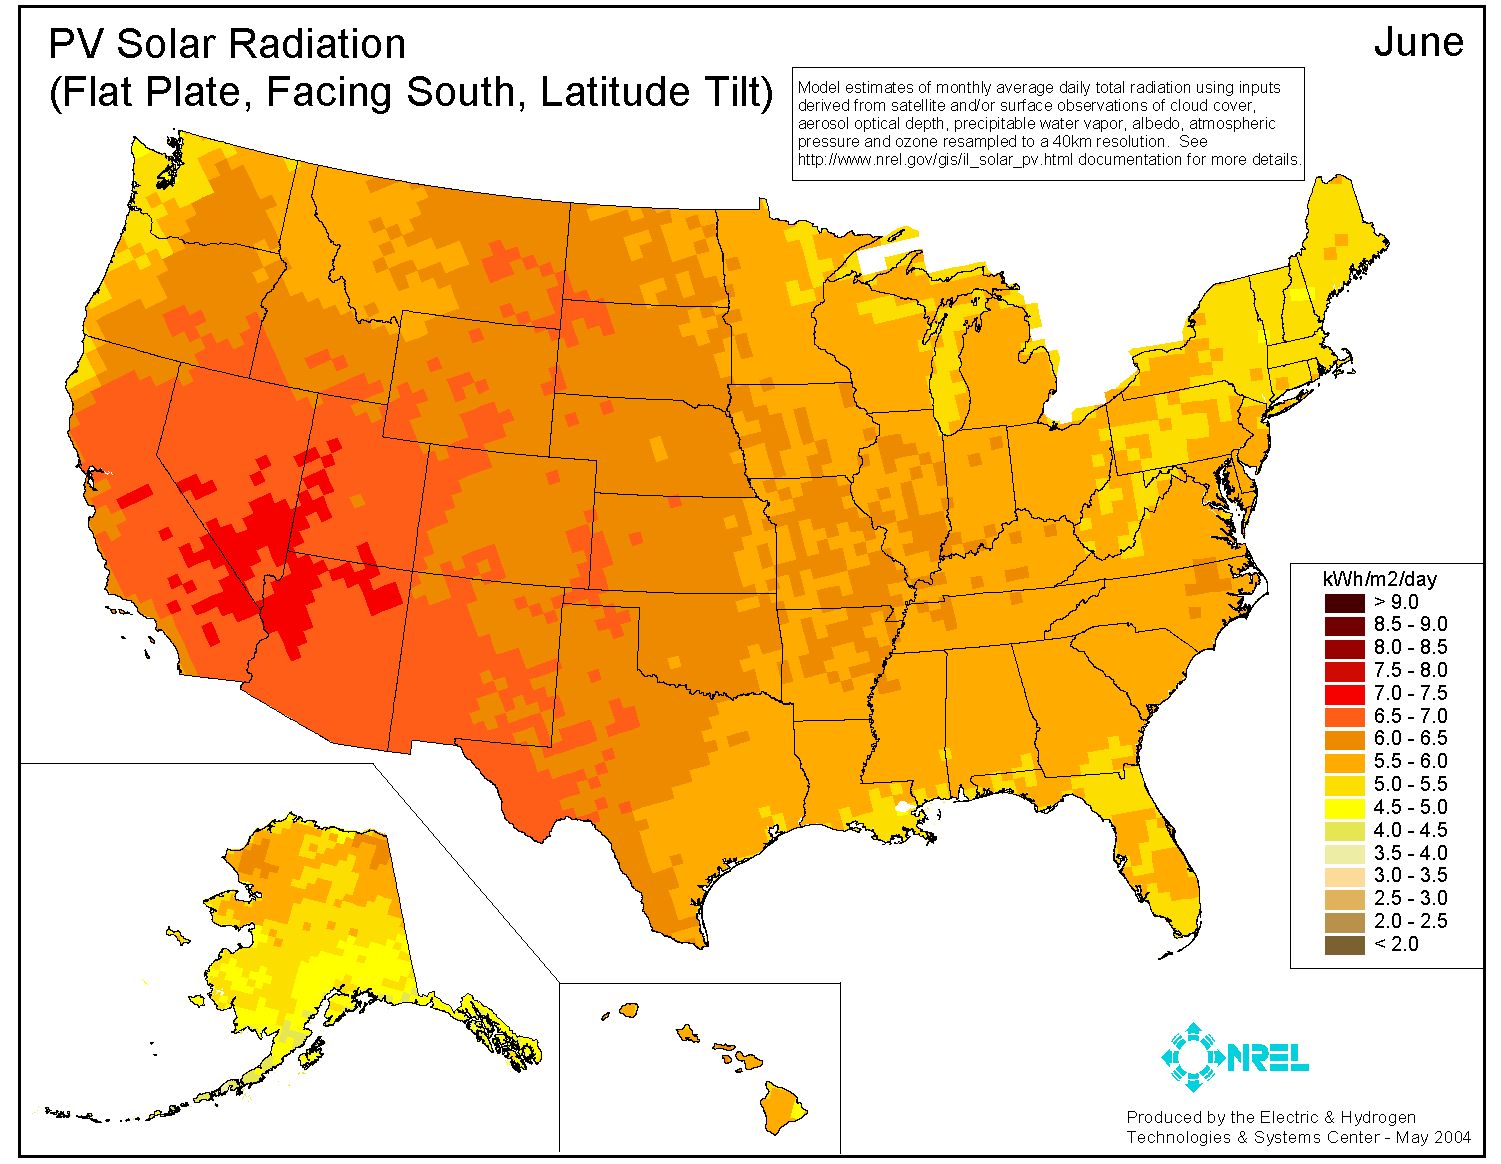
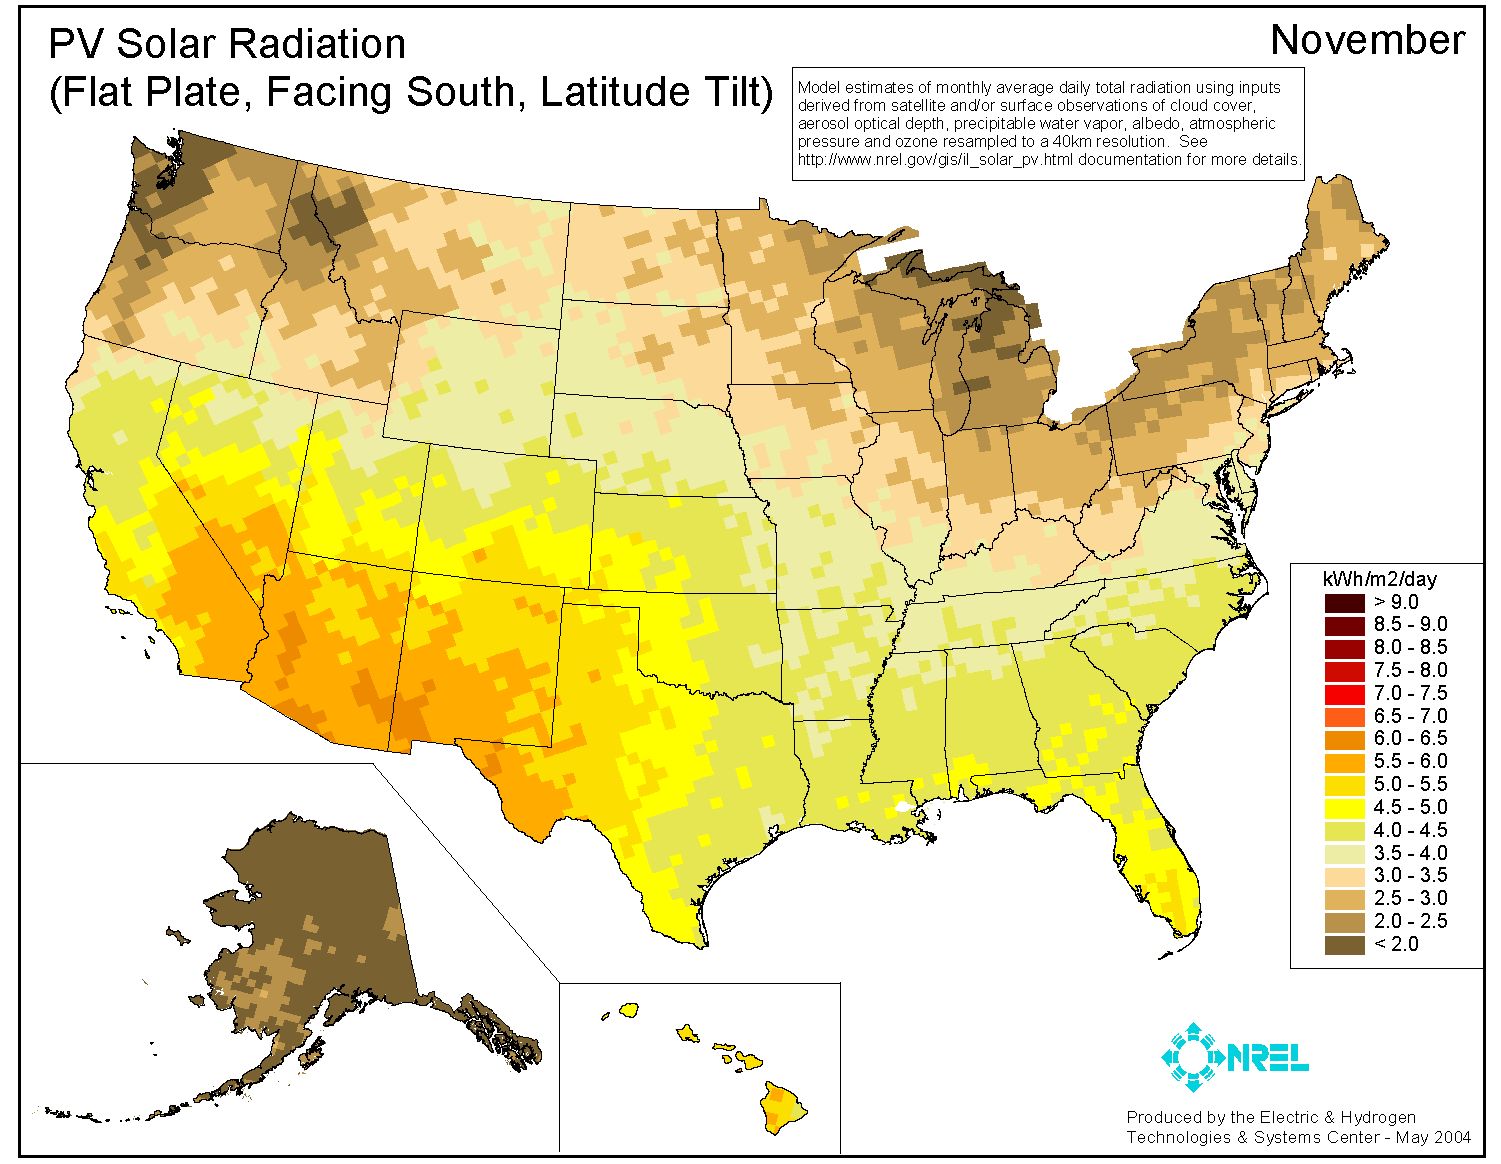
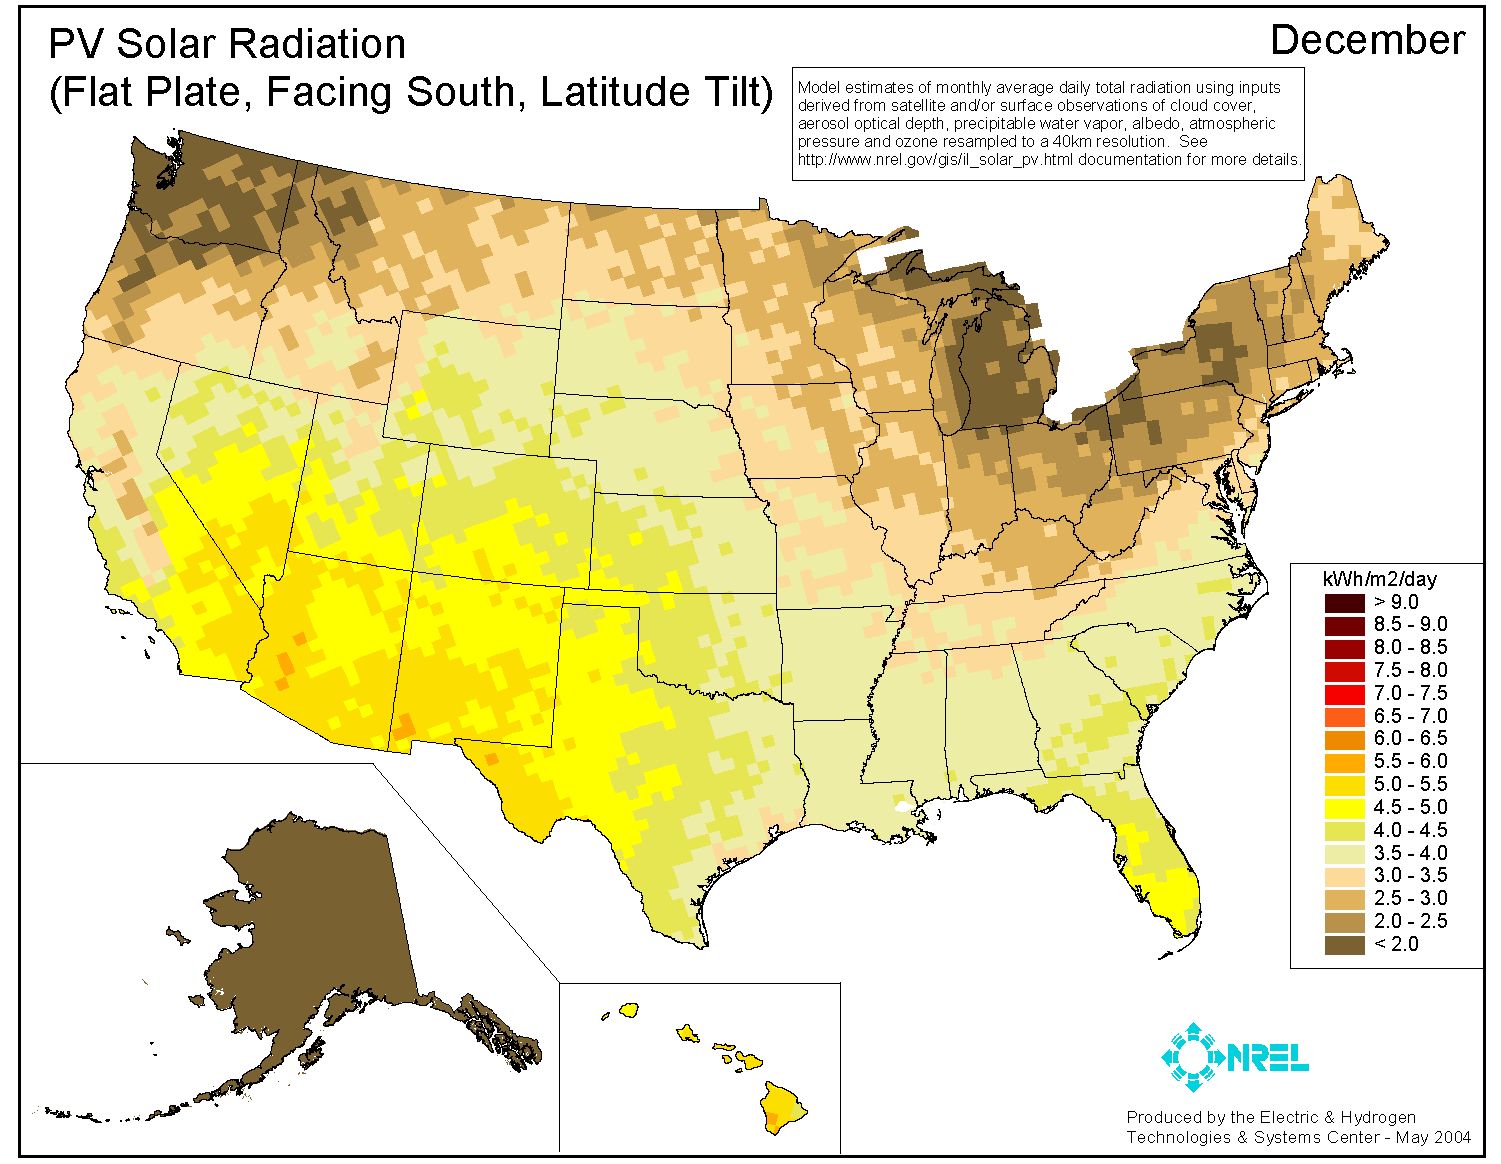
Here are some good US irradiance maps to show how the amount of irradiance varies throughout the US. Please click on these images for a larger version.
The following map has a nice scale that shows the annual irradiance difference.
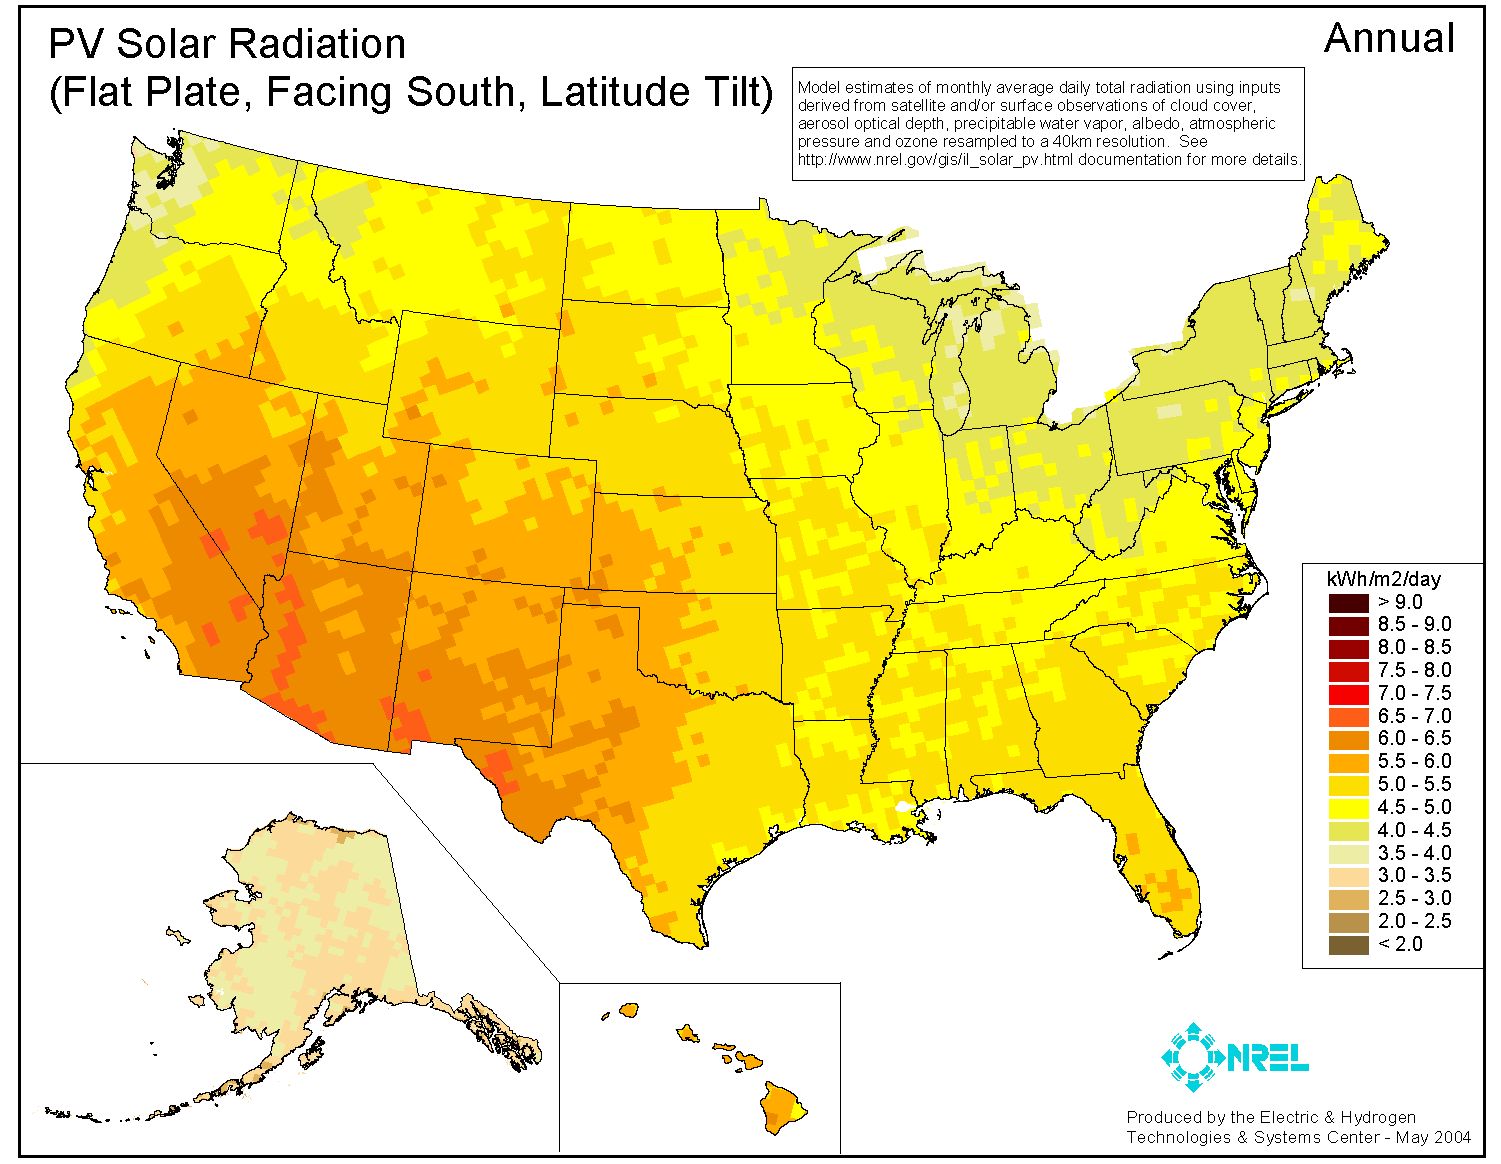
The following map is the same as the one above. Please note the data is approximately the same. The difference is appearance is from the scale selected.
Annual
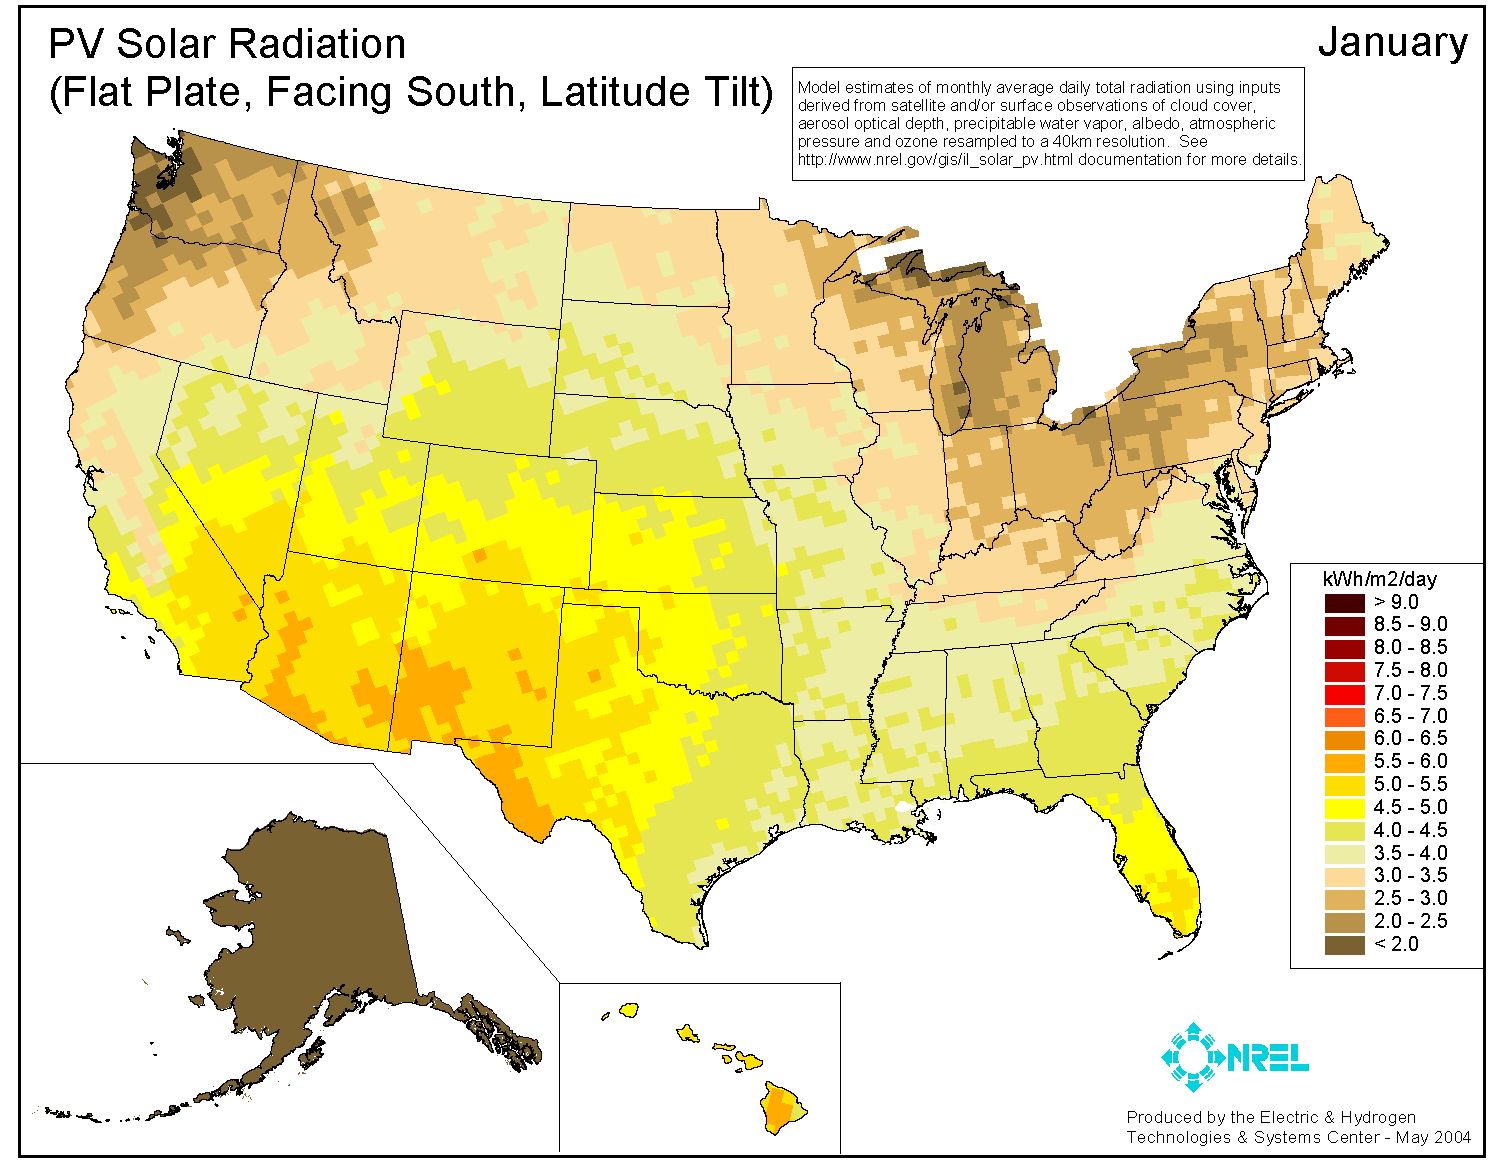
Jan
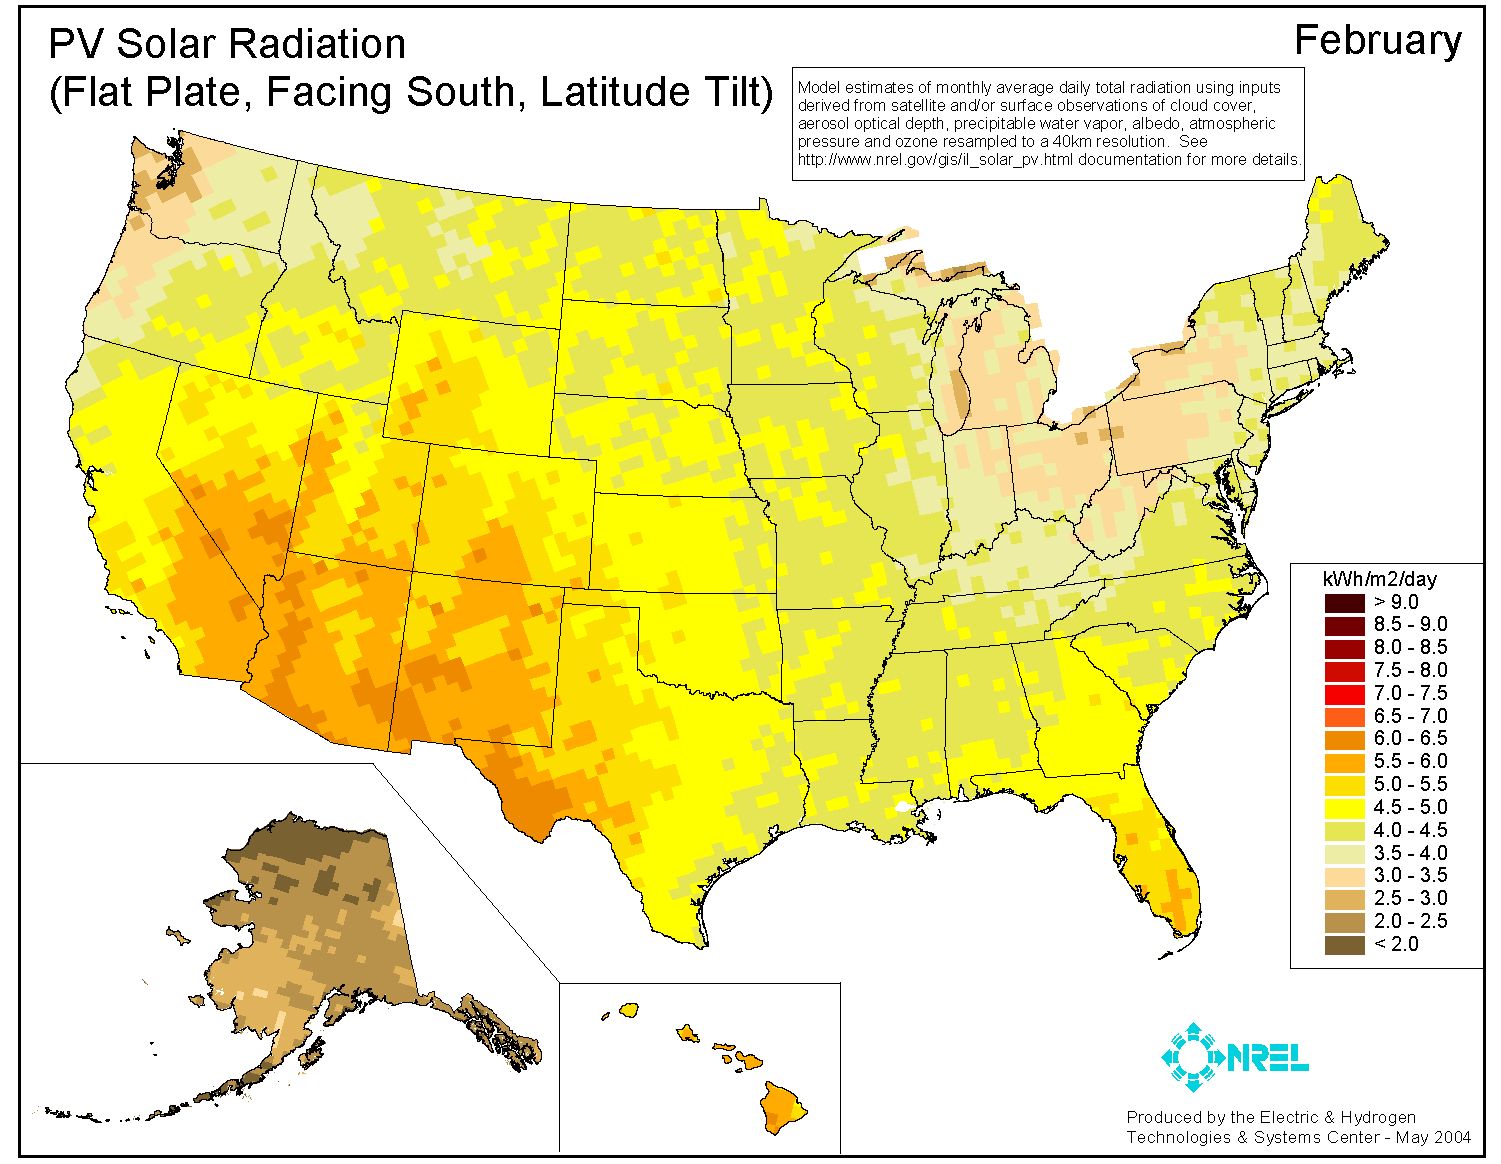
Feb
Mar
Apr
May
Jun
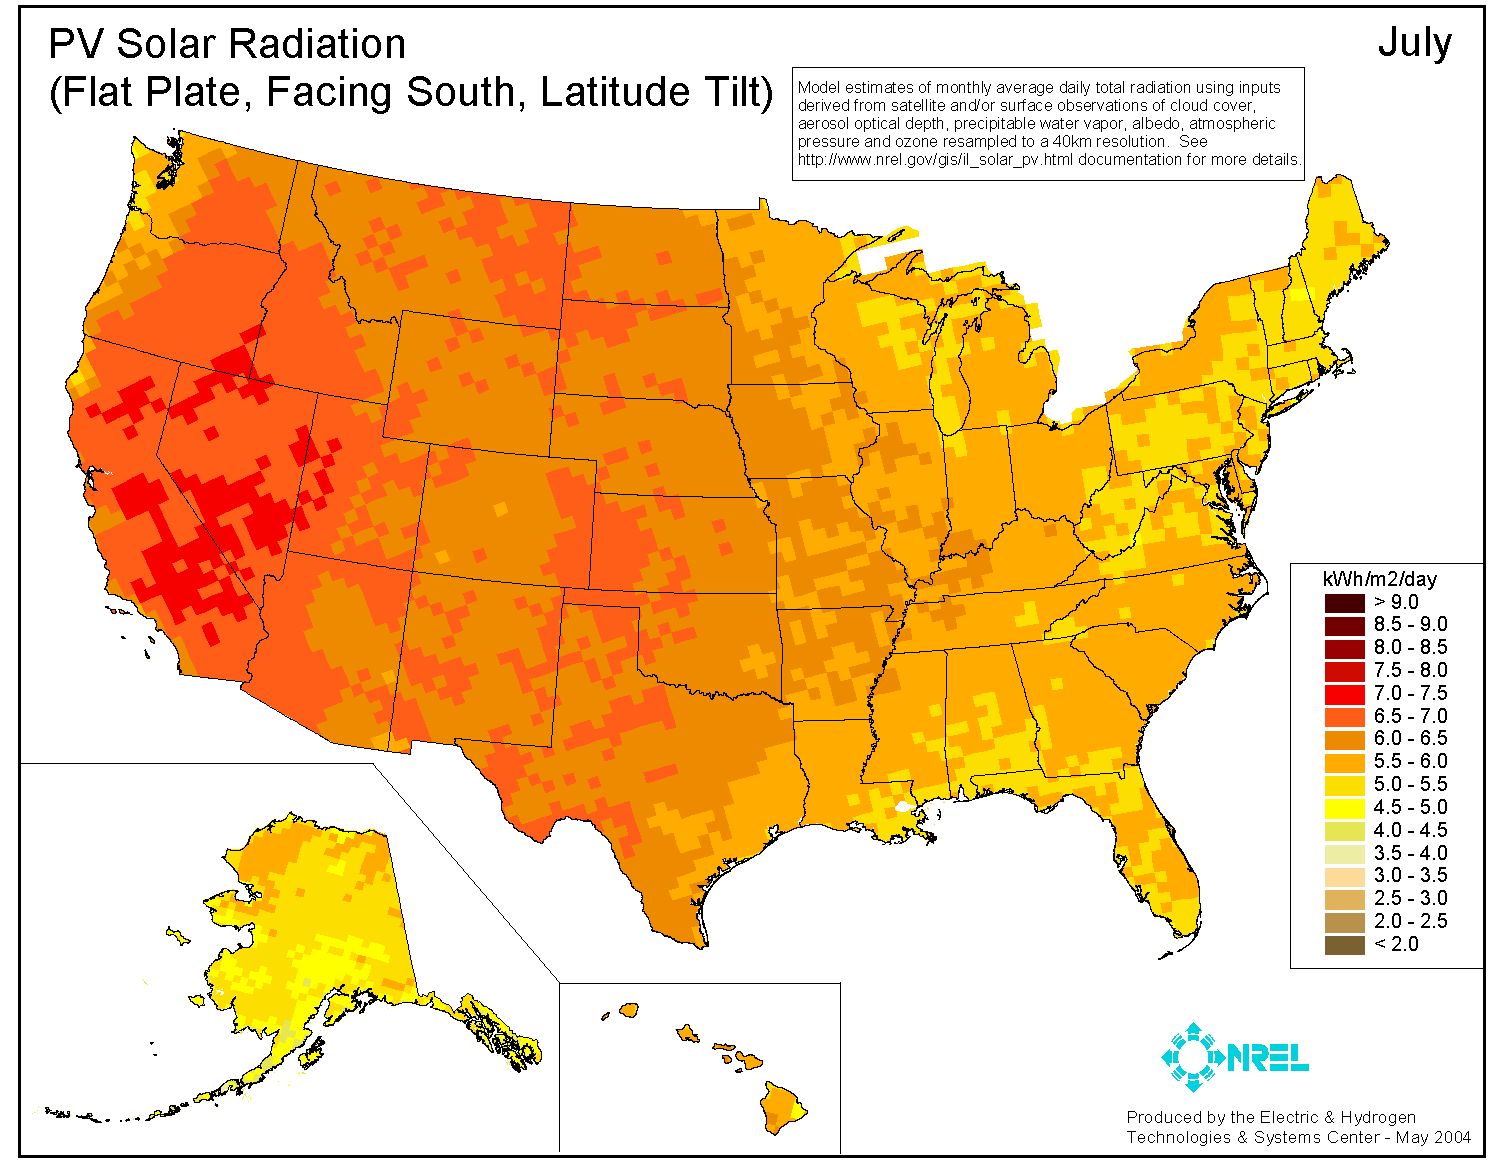
Jul
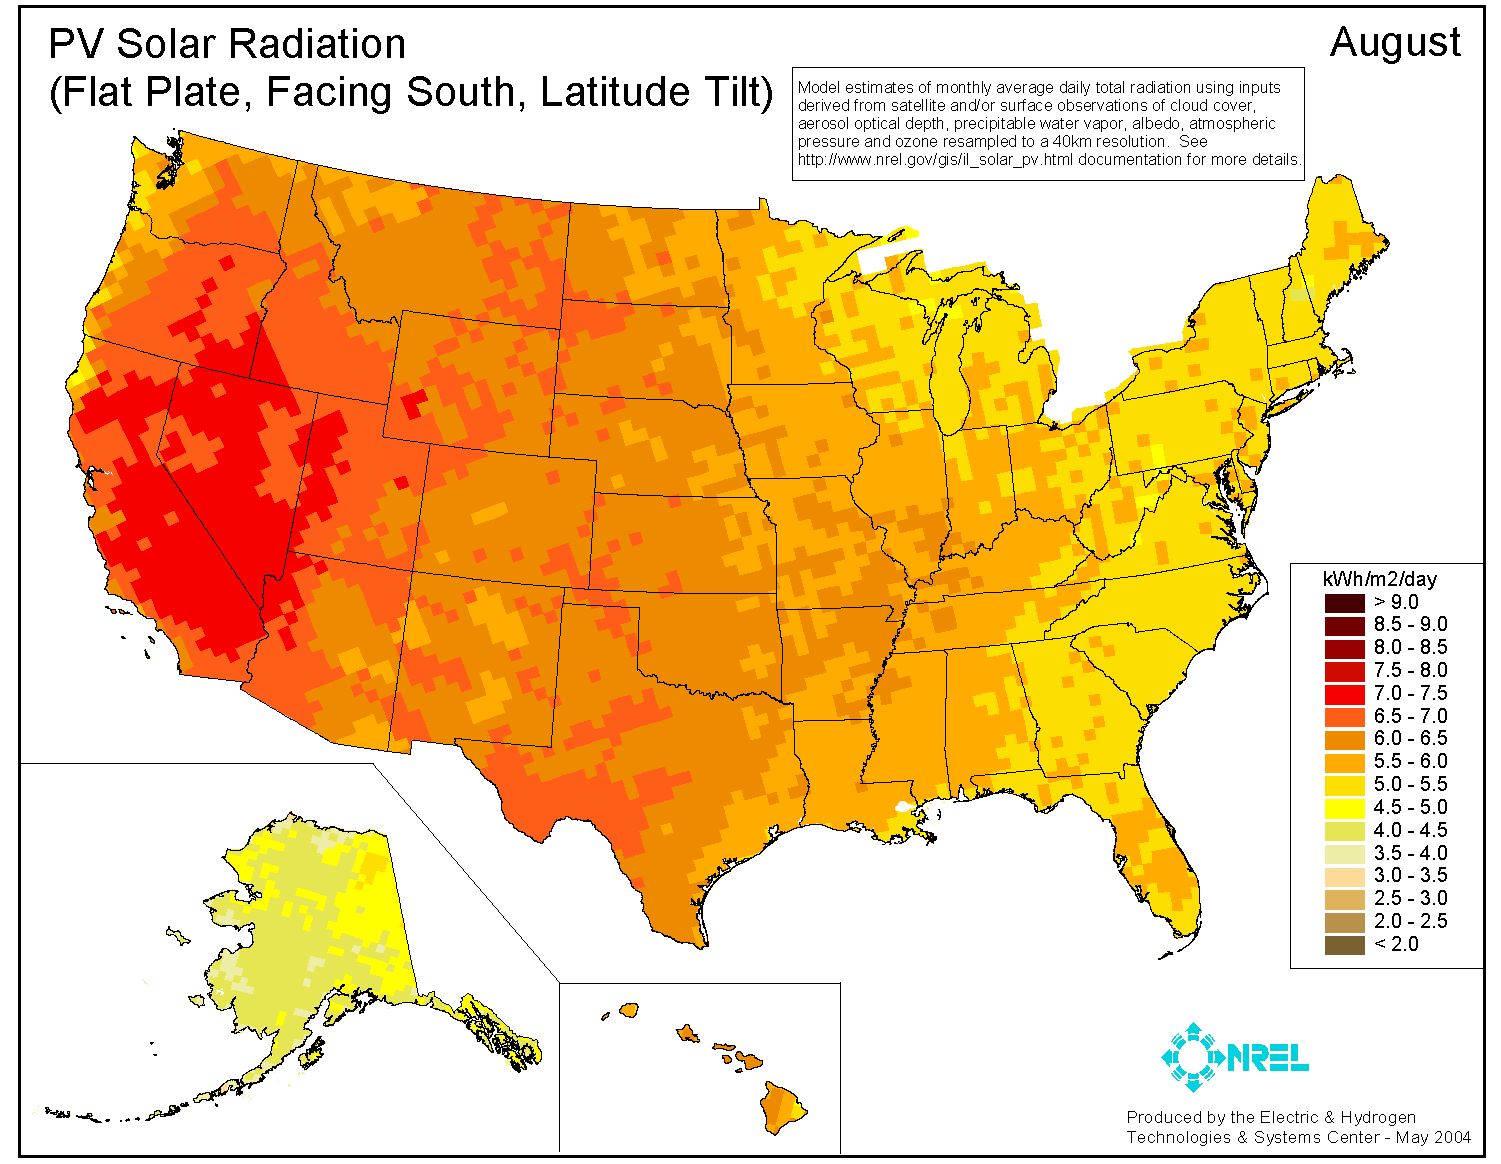
Aug
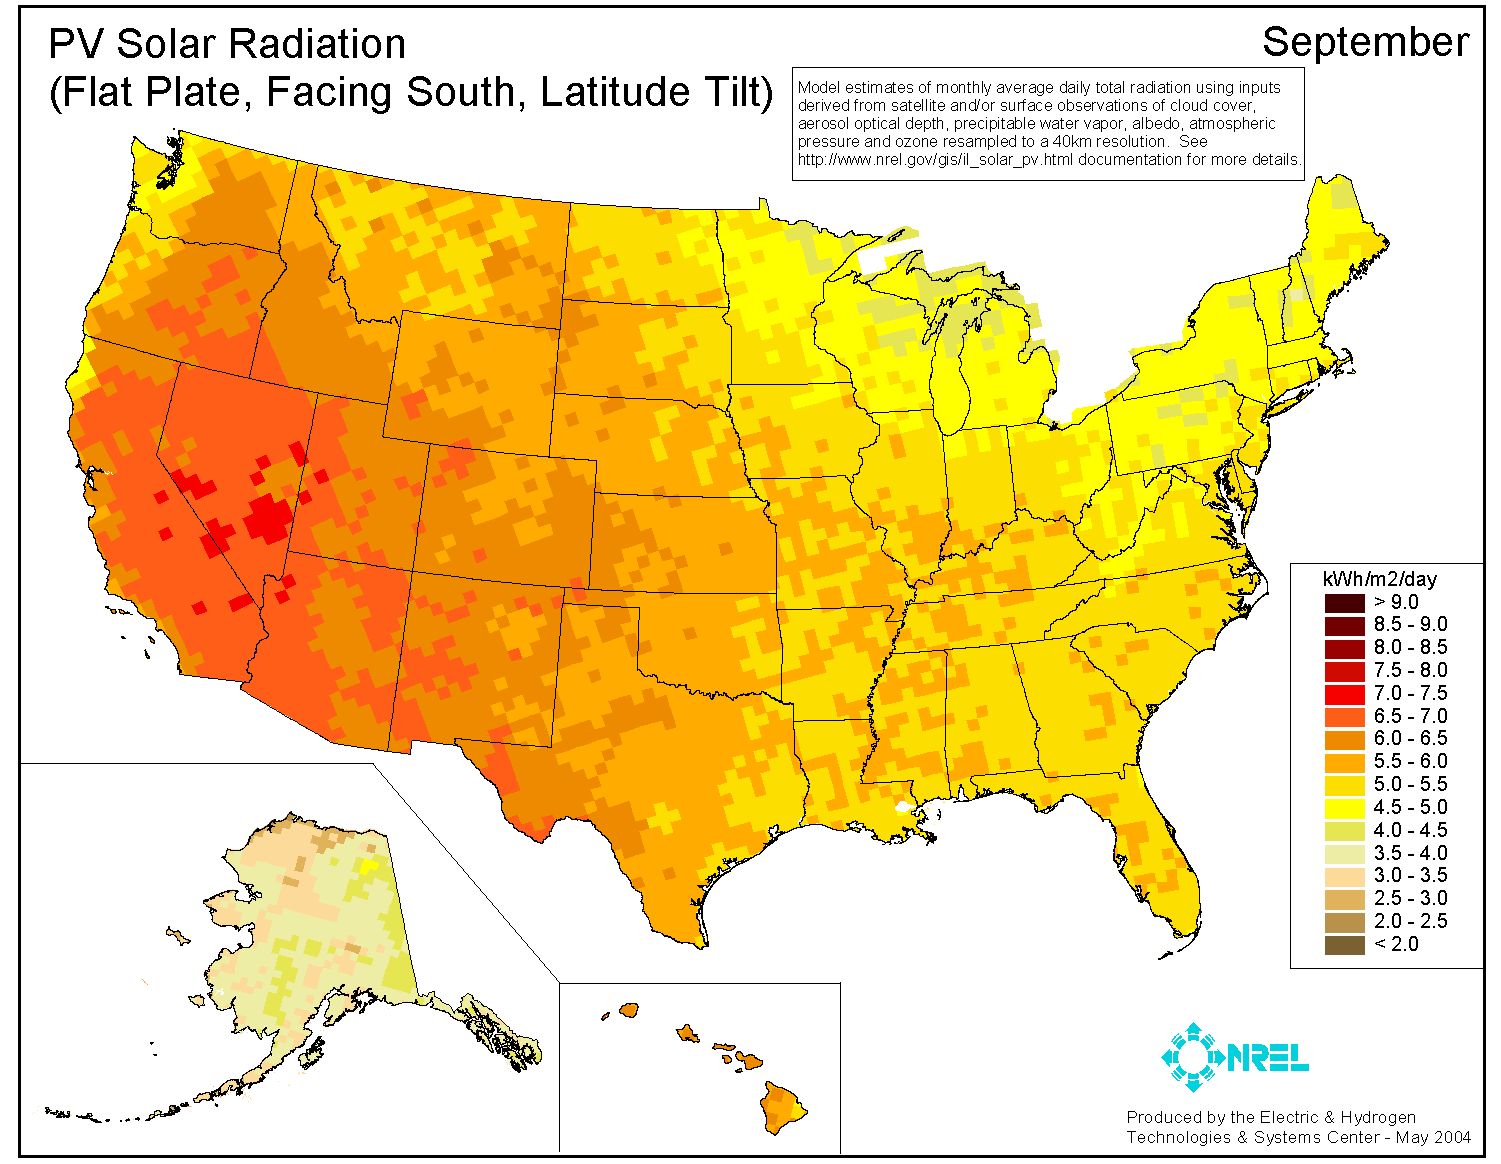
Sep
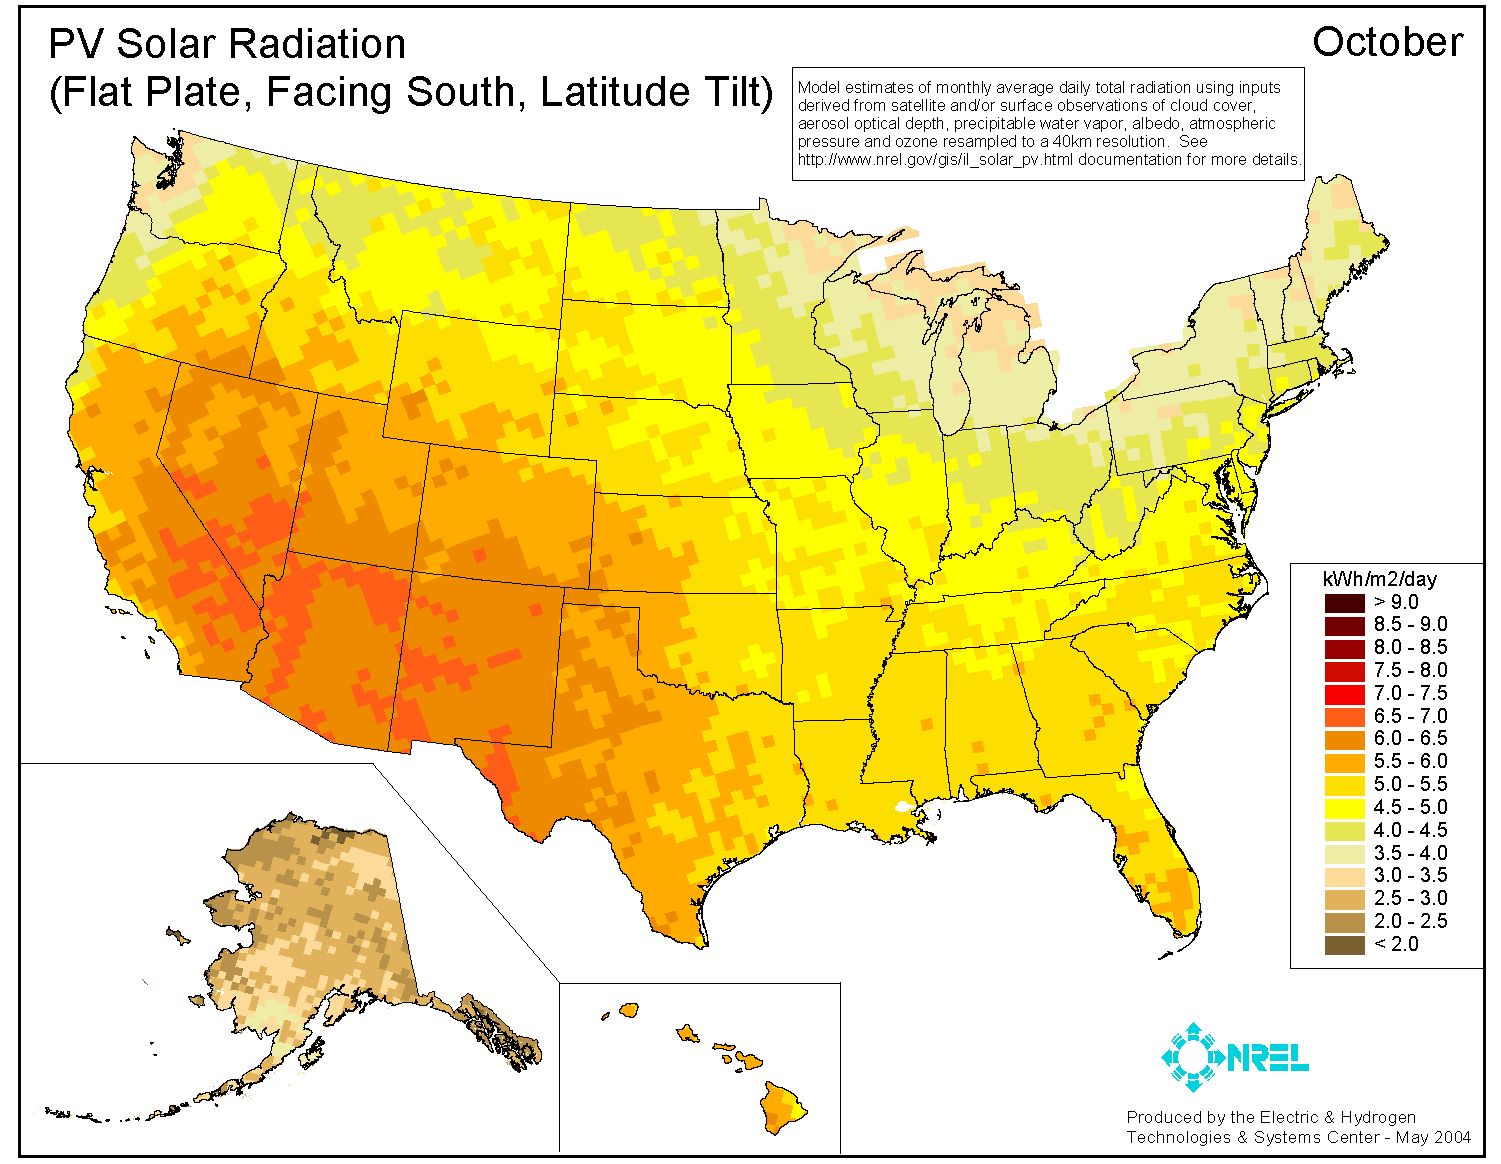
Oct
Nov
Dec
This post is licensed under
CC NC ND 4.0
by the author.